My Qwen 3.8 Flash Next on Strata Got 40% Slower Overnight, and It Wasn't the GPU
Oct 22, 2026
I've been running Qwen 3.6 35B A3B on my Arc Pro B70 for a while. It is blazing fast and not good enough: under stress testing — long agent loops, dense instruction following, code that has to actually run — a model with only a few billion active parameters drifts in ways I kept having to design around.
So I went looking for Qwen 3.8. The 27B is a better model and far too heavy for one 32 GB card at any context length worth using (that fight is a post of its own, coming soon). While I was working out how to make a bigger model live on this hardware, Strata kept turning up — it has been generating real buzz for getting large MoE models running on cards that have no business running them. So I gave it a try.
It worked. Then it got slow.
Two days ago it was doing 42–45 tokens per second of decode. This morning it was doing 26–28. I had changed nothing. No model swap, no driver update, no config edit — just a reboot in between, which turned out to be the most misleading variable in the whole investigation.
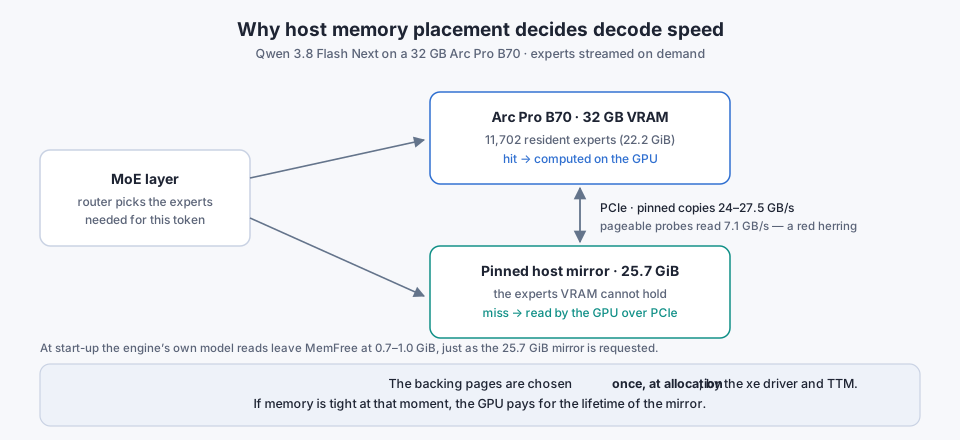
The short version: the engine keeps a pinned host-memory mirror of model experts that the GPU reads over PCIe. Those pages are allocated by the kernel driver, and which pages it hands out depends on how much memory was free at the moment of allocation. Pages taken while the kernel was reclaiming page cache are read by the GPU at 55–85% of full speed — while the CPU reads the very same pages at full speed. Nothing about the GPU, the link, or the model was wrong. The allocation had just landed in a bad place.
A 45-line opt-in patch that drops the model files' page cache before the mirror is allocated made every restart run at 42–44 tok/s again. It is deployed, survived a five-hour soak test, and is now a draft upstream PR.
The setup, in one paragraph
A desktop box with an Intel Arc Pro B70 (32 GB), an i7-12700K and 61 GiB of RAM, serving a quantized Qwen 3.8 Flash Next MoE at 262K context through Strata's SYCL engine. The model does not fit in VRAM, so it runs with --stream-experts: a slice of the experts lives in the 32 GB of VRAM, the rest is mirrored in pinned host memory and streamed to the GPU over PCIe as the router asks for them. MTP speculative decoding is on.
That architecture is the whole story, because it makes decode speed a function of host memory bandwidth as seen by the GPU — a quantity I had never measured and wrongly assumed was fixed.
Three wrong diagnoses
I want to be honest about this part, because the first version of my analysis was assembled from log files and release notes, and it was confidently wrong on every count.
"The PCIe link only does 7.1 GB/s." The engine prints a start-up line: PCIe probe: 7.1 GB/s host->device -> pcie_frac 0.19. That looks like a smoking gun for a card in a x4 slot. It is not. That probe times a pageable copy, which is a known-bad path (upstream #1745). When I measured pinned copies directly — the ones the engine actually uses — the same link did 24–27.5 GB/s. The auto-tuned pcie_frac was derived from a number that had nothing to do with the real transfer path.
"The crashes are the known copy-engine hang." There were UR_RESULT_ERROR_DEVICE_LOST failures in the log, and there is an open upstream report of the Arc copy engine wedging the card. Plausible, tidy, wrong. On-host checks showed the engine was starting with 1.6 GiB of VRAM free, and a ccs job then hit the xe driver's 5-second timeout, which loses the device. Starvation, not a hang.
"The binary is stale." The engine binary's timestamp predated its own source checkout by about seven hours. It didn't: I had misread the time zone. And the "missing" --suffix-draft flag I went looking for was already on.
The lesson here is not "read the logs more carefully." It's that a coherent story built from other people's bug reports is not a measurement. Every one of those three conclusions came from matching my logs against someone else's described failure.
A real PCIe fault that turned out to be a distraction
The one thing that genuinely looked broken: the PCIe link was running as Gen5 x16 and logging about 2,900 AER RxErr/BadTLP errors. Signal integrity problems, real errors, exactly the kind of thing you'd expect to explain a slow GPU.
After a reboot the link trained as Gen4 x16 with zero errors, and decode recovered to about 36 tok/s. Case closed? No — for two reasons.
First, auto_link_downgrade_status was 0, meaning the card had never actually dropped itself to Gen4; the boot-time training just landed there. Second, and decisively: bandwidth fell again within 45 minutes on that same clean, error-free Gen4 link. Pinned transfers went from 27.5 GB/s down to 11–17.6 GB/s with no AER errors and no driver complaints.
So the link quality was a real issue worth fixing eventually, and completely irrelevant to the slowdown.
The measurement that found it
I wrote a microbenchmark that allocates 13 chunks of 2 GiB with malloc_host (Level Zero pinned host memory), fills them, and then reads them two ways: a plain CPU pass, and a GPU copy plus a GPU compute kernel. Same buffers, same bytes, two readers.
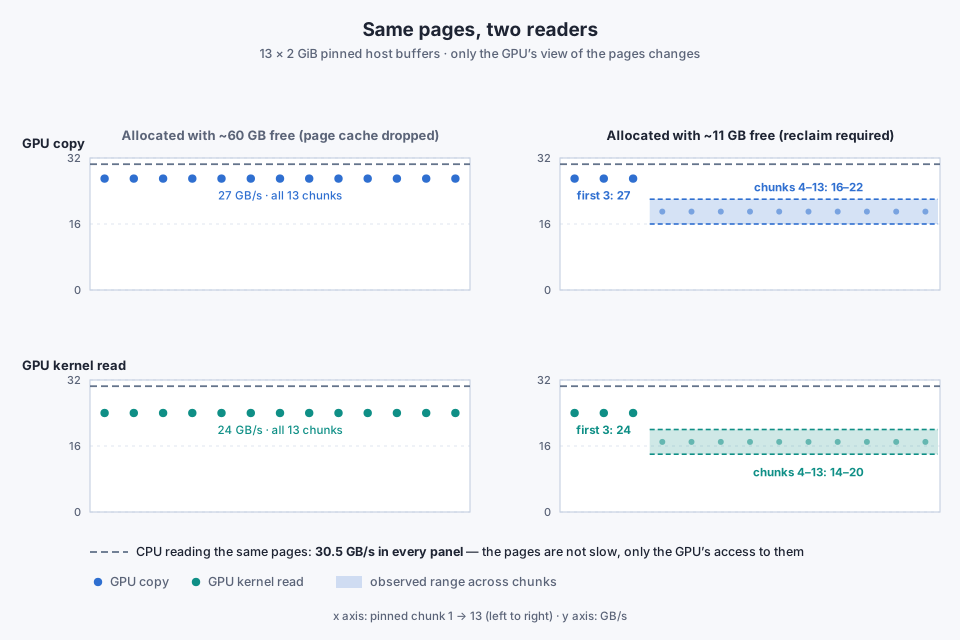
| State of memory when the chunks were allocated | GPU copy (GB/s) | GPU kernel read (GB/s) | CPU read (GB/s) |
|---|---|---|---|
| Page cache dropped, ~60 GB free | 27 (all 13 chunks) | 24 (all 13) | 30.5 |
| ~11 GB free, allocation needs reclaim | 27 for the first 3 chunks, then 16–22 | 24 for the first 3, then 14–20 | 30.5 everywhere |
Two things fall out of this table.
The CPU reads every page at full speed regardless. So the pages are not slow, the memory is not slow, and there is no ECC or thermal story. Only the GPU's access degrades.
And the degradation is positional: the first three chunks are fine, the rest are not. That is exactly what you'd expect if the driver satisfies early requests from a healthy pool and then starts pulling reclaimed pages. Level Zero debug logs confirm each chunk is a single XE_GEM_CREATE system buffer object with no internal chunking — the xe driver and TTM choose the backing pages, and the engine never gets a say.
The last confirmation was the crudest one: run drop_caches and compact_memory as root, restart the engine, and decode comes back at 42.4 tok/s on the Gen4 link. Free memory at allocation time was the variable all along.
At engine start, the engine's own model reads left MemFree at 0.7–1.0 GiB at the moment the mirror needed 25.7 GiB. Of course it got reclaimed pages.
The fix, and the version that made things worse
My first patch attempt did the obvious-sounding thing: after filling the mirror, drop the page cache of the ranges that had just been mirrored, to give the pressure back. That made restarts slower — 27.6–30.3 tok/s against 35.5–38.9 without it. I was optimizing the wrong moment. The important instant is free memory at the moment of allocation, not afterwards.
The version that works drops the model files' page cache before the mirror is allocated, so the pages the driver finds are already clean and free.
Each arm restarted the engine four times in a row, reading an unrelated 22 GB file between starts to rebuild the page cache — i.e. deliberately recreating the bad condition. Prompts at 2K and 32K, 512 tokens out, temperature 0.
| Runs | Without the patch (restarts 2–4) | With DROP_CACHE=before (restarts 2–4) |
|---|---|---|
| Measurement build (24 starts) | 36.4–39.2 tok/s | 44.1–44.5 |
| Trimmed PR build (16 starts) | 37.5–41.4 tok/s | 42.4–44.5 |
The cost is about one extra second on the mirror fill, because it now reads from NVMe instead of the page cache it just evicted. Outputs were byte-identical across arms — which is the bar I want for any patch that touches memory layout: it may change how fast the answer arrives, never the answer.
Worth noting: the patch is opt-in. It is not obviously right for a box with a different memory profile, and I'd rather ship a switch than silently change someone else's machine.
Things that did nothing
Equally useful, if less exciting:
| Change | Result |
|---|---|
--pcie-frac forced to 0 / 0.40 / 0.55 |
3–8% slower than the automatic 0.20 |
EnableRecoverablePageFaults=0 |
1–2% slower; keep only as a DEVICE_LOST fallback |
STRATA_IQ_DECODE_FAST=1 |
no measurable change, byte-identical output |
| Upgrading the engine to the latest release | no change for this quantization at all |
That last row is worth sitting with. I spent real time on version archaeology — comparing my build against 392 upstream commits, reading release notes for card-specific optimizations — and the version was not a factor. The two card-specific optimizations I found were already active in the build I had.
Soak test and real traffic
A patch that wins an A/B on restarts is not a deployment. The five-hour soak: Poisson arrivals with a 120-second mean, prompts from 1K to 128K tokens, 170 requests including 57 follow-up turns, and 6 random restarts, 5 of them immediately after reading a 16–22 GB file to force the bad allocation condition.
- 0 errors, 0 wrong answers, 0 AER, 0
xeerrors, swap ~0. MemFreebefore the drop was 1.2–5.9 GiB at each restart; after it, 29–41 GiB.- A fixed 2K probe held 58.0–59.5 tok/s across all 13 runs.
Real usage the next morning, on a long agent conversation at 179–194K context: over 34 requests, 96.8% of prompt tokens were reused, median time-to-first-token 2.2 s, median decode 34 tok/s in a 22–42 range. The spread tracks speculative-decoding acceptance, which swung between 41% and 87% — a different, larger lever than anything in this post.
The very first request of that session took 161 seconds, which is a story of its own.
The second fix: making conversations survive a restart
That 161-second request happened because earlier restarts had evicted the conversation state, forcing a full re-prefill of ~180K tokens.
There is an upstream PR (#1937) adding a conversation disk tier — checkpoints of conversation state written to disk and reloaded on demand. It just didn't exist on Intel: the feature is wired into src/program/generate.cpp, but the SYCL engine compiles its own sycl/src/program/generate.cpp, so the --conversation-disk-* flags simply weren't there. Porting it took 12 pieces across +159/−16 lines.
| Test on the B70 | Result |
|---|---|
| 160K-token conversation, cold | 139.8 s to first token |
| Same conversation after an engine restart, from disk | 4.3 s (4.8 GB read at 1.4 GB/s), byte-identical answer |
| Evicted by three other conversations, then resumed | 5.0 s |
| Shutdown save | 4.6 s (4.8 GB at 1.8 GB/s) |
The mechanism is prefix matching: a resumed request restores the longest matching prefix — either the live state or a checkpoint taken every 8K tokens — and computes only the remainder. Which also tells you when it doesn't help: a client that compacts the beginning of its history leaves only the system prompt matching, and you pay full price again.
Two operational notes I'd want written down before deploying this myself. An 180K-token conversation costs about 5.5 GB on disk, so a 32 GiB budget holds roughly five conversations with the oldest dropped first. And with persistence enabled the engine ignores SIGTERM, saving conversations only when the server sends an explicit quit — so kill -9 on the engine silently loses whatever was only in RAM.
Upstream
- Issue — mirror bandwidth depends on memory state at engine start: Niko1221/Strata#3681
- PR —
STRATA_MIRROR_DROP_CACHE=before, +45 lines of code and docs, draft, CI passing: #3761 - Port — SYCL conversation disk tier with B70 measurements, as a comment on #1937; waiting on the maintainer to pick among six competing disk designs
What I still don't know
Why are reclaimed pages slow for the GPU? I've localized it, not explained it. The two candidates are IOMMU mapping and the GPU's own page tables. Testing the difference means booting with iommu=pt and tracing TTM page orders with bpftrace. If it lands on xe, it belongs in a driver bug report, not a Strata patch.
Should I chase the Gen5 link? The options are locking Gen4 in the BIOS for predictability, or reseating the card and checking the riser for a clean Gen5. Right now the box happens to train at Gen4 with zero errors — and the next boot might land on the noisy Gen5 training again.
The Intel stack is behind, for stability rather than speed: compute-runtime 26.35 while deliberately keeping IGC 2.40.x (2.41.5 has regressions), a pending kernel update carrying an xe ring-ordering fix, and a newer GuC. I have not even read the card's firmware version yet.
Lessons
"Bandwidth" is not a property of a link. It's a property of a link, an allocator, and the memory state when you allocated. On a streaming-experts architecture, host memory placement is a first-order performance variable.
Reboots are a confound. An earlier "Gen5 is 40% faster" result of mine was measured three minutes after boot. It was mostly fresh memory. Any measurement taken shortly after a reboot is measuring a machine nobody runs in production.
Measure the thing you blame. Every wrong turn came from a plausible mechanism borrowed from a bug tracker. The microbenchmark that read the same pages from CPU and GPU took an afternoon and settled it immediately.
Byte-identical output is the bar. For a patch that changes memory layout, "same numbers, faster" is the whole requirement, and it should be verified rather than assumed.